Fall is the one season when everything outside changes fast enough to measure. You don’t need a whole year to see it change, just a couple of weeks. That makes it the easiest time there is to do real science with your kids, without buying anything.
The tree in your yard is a different colour on Friday than it was on Monday. You lose a few minutes of daylight every single day. Seeds are leaving, squirrels are burying, and the spiders are building bigger webs than they did all summer. For about six weeks, your whole neighbourhood is running an experiment. Your kid just has to start taking notes.
Every activity below has something to count, time or predict, which is where the math and the writing come in without anyone calling it a lesson. Most need nothing but a notebook, a phone camera and a walk you were going to take anyway. (If you live in the Southern Hemisphere, save this one for March.)
The one fact that makes fall worth studying
Leaves don’t turn yellow in the fall. The yellow and orange were there all summer, hidden under the green. Green comes from chlorophyll, the pigment a leaf uses to make food from sunlight. When the days get shorter and the nights get cooler, trees stop replacing it, the green fades, and the yellows and oranges underneath finally show.
Reds are a different story. Many trees make their red pigment new in the fall, and a run of sunny days with cold nights makes it brighter. That is why some autumns are spectacular and others are mostly brown. Tell your kid this on the first walk, and three of the investigations below suddenly have a question behind them.
Trees and leaves
1. One tree, every day
Pick one tree you pass every day. Same spot, same time of day, one photo. That’s it. After a week, line the photos up and ask: how much of it is still green? Kids can estimate it as a fraction or a percentage (“about three quarters green”) and graph it. After three weeks they have a real data set, and they can predict the day it will be bare. Younger kids just sort the printed photos in order and describe what changed. Older kids can track two trees of different kinds and find out which one turns first, and why.
2. The hidden colours in a green leaf
This is the experiment that proves the yellow was there all along. Tear a few green leaves into small pieces, put them in a small jar, and add just enough rubbing alcohol to cover them. Stand the jar in a bowl of hot tap water for about half an hour, until the alcohol turns green. Then hang a strip of coffee filter from a pencil laid across the jar, so the bottom of the strip just touches the liquid. Over the next hour or so, the liquid climbs the paper and splits into bands: green, and then yellow above it that nobody could see in the leaf.
An adult handles the alcohol, and the hot water comes from the tap, never the stove. Older kids can run it as a fair test: one green leaf, one yellow leaf, one red leaf, three strips side by side. Which bands show up in all three? Which ones are missing?
3. The falling leaf count
Mark off a square under one tree with four sticks and a string (a metre or a yard on each side is plenty). Every day, count the leaves that landed inside it, then clear them out. Tally marks for little ones, a table and a line graph for older kids. The graph climbs, peaks and drops off, and the big question is: when is the peak day, and can you predict it before it happens? Windy days and rainy days make great “what happened here?” moments on the graph. If your kid likes this kind of close-up ground study, a Square Foot Safari is the same idea taken further, across every living thing in one small square.
4. Leaf litter, layer by layer
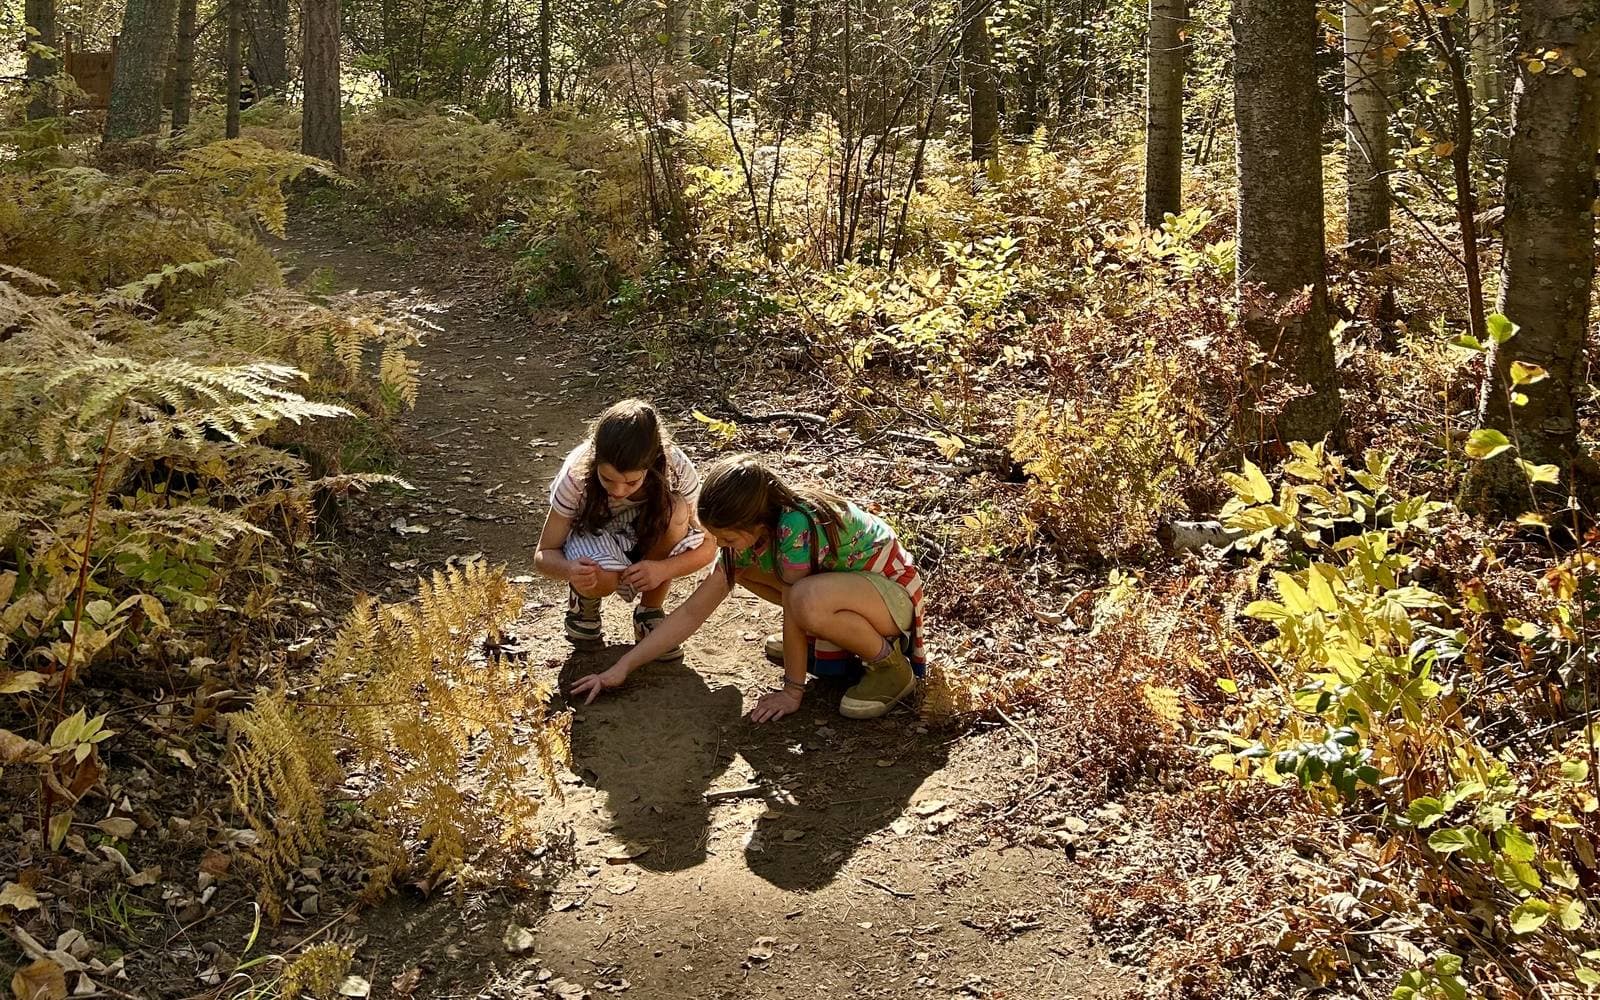
Find a spot under trees that nobody rakes. Gently peel back the leaf litter, one layer at a time, and lay each layer out on a sheet in order. The top is this year’s leaves, whole and crisp. Underneath they get darker and full of holes. Further down they are broken into pieces, and at the bottom they have turned into something that looks like soil. That is decomposition in slow motion, a few centimetres deep. Kids count what lives in each layer (worms, pill bugs, white threads of fungus) and draw the layers like a cake. Wash hands after, and put every layer back when you’re done.
In the Membership
Decomposition Detective
If this one hooks them, Decomposition Detective turns it into a weeks-long experiment: a jar of leaves and soil, predictions, the decomposers behind it, and a real fair test.
Seeds on the move
5. The helicopter seed drop
Collect a handful of maple seeds, the winged ones kids call helicopters. Drop them one at a time from the same height (the top of a slide or a step stool works), and time how long each one takes to land. Then pull the wing off one and drop the bare seed. It falls much faster. The wing makes the seed spin, the spin creates lift, and a slower fall gives the wind more time to carry it away from the parent tree. Kids can average five drops, compare two kinds of winged seed, or test whether a bigger wing means a longer fall. Ages 6 and up can time it; ages 10 and up can calculate averages and make a chart.
6. The hitchhiker test
Some seeds don’t fly. They hitch a ride. Walk through a weedy field edge in an old fleece or wool socks pulled over your shoes, then sit down and count what stuck. Sort the hitchhikers by how they grip: hooks, barbs, sticky coating. Then tell your kid this story. In 1941, a Swiss engineer named George de Mestral came home from a walk in the Alps with burdock burrs stuck to his clothes and all over his dog. He looked at one under a microscope, saw that it was covered in tiny hooks, and spent years turning that into Velcro. The challenge: which seed from your sock would make the best fastener, and why?
In the Membership
Seed Travelers
Seed Travelers walks your kid through collecting seeds and testing every way they travel, by wind, water, animal and gravity, then designing the ultimate seed.
Animals getting ready
7. Ten minutes with a squirrel
Grey squirrels spend the fall scatter-hoarding: burying nuts one at a time in dozens of shallow holes instead of one big pile. They find many of them again weeks later using memory and smell, and the ones they forget can grow into trees. Pick one squirrel and watch it for ten minutes. Tally every nut buried, every hole dug up, and every time it seems to pretend to bury something (researchers have caught grey squirrels doing this when another squirrel is watching). Kids end up with a real behaviour log, and a much better question than “what do squirrels eat?” Birds work the same way; if your kid would rather count those, here is how to start bird watching with kids.
8. The spider web survey
If it feels like there are suddenly webs everywhere in early fall, there are. Orb weaver spiders hatch in spring and grow all summer, so by now they’re big, their webs are big, and many of them leave the web up during the day. Pick a short route you walk often and count the webs on it, on dewy mornings if you can, when every strand shows. Measure the widest ones with a ruler held close (no touching). Is the count going up or down as it gets colder? Kids who are nervous about spiders often get curious once they’re measuring instead of avoiding.
9. The camouflage hunt in fallen leaves
Cut ten short pieces of yarn in different colours: bright green, red, yellow, brown, blue. One person scatters them in a patch of fallen leaves, and the other gets one minute to find as many as they can. Write down which colours were found and which ones “survived.” Swap and repeat a few times, then add up the results. Usually the browns and oranges survive and the blue and green get caught, which is exactly why so many fall animals are brown. Kids who love this can go deeper with the Camouflage Challenge.
Sky, weather and fungi
10. The daylight countdown
Day length changes fastest around the fall equinox in late September, so early October is the best time of year to catch it moving. Every day, write down the sunset time (a weather app has it, or kids can note when the streetlights come on). Subtract each day from the one before. In much of Canada, the northern US and the UK, you lose roughly two to four minutes of daylight a day right now; closer to the equator it barely changes. Kids can graph it, calculate a weekly total, and predict the date when it will be dark before dinner. Ages 6 to 8 can just mark it on a calendar and notice; ages 11 and up can work out the rate of change.
11. Predict the first frost
Put a cheap thermometer outside, somewhere shaded, and have your kid read the temperature at the same time every morning. Log it, graph it, and draw a line through the trend. When does the line hit zero (or 32°F)? That is their first-frost prediction. Then look up the average first-frost date for your area on a local gardening site and compare. The day the frost actually comes, you will have the most invested weather forecaster in the house.

In the Membership
Nature Data Tracker
For kids who love the numbers side, Nature Data Tracker walks them through tracking daylight, temperature or rain for a week or two, charting it and predicting what comes next.
12. A mushroom spore print
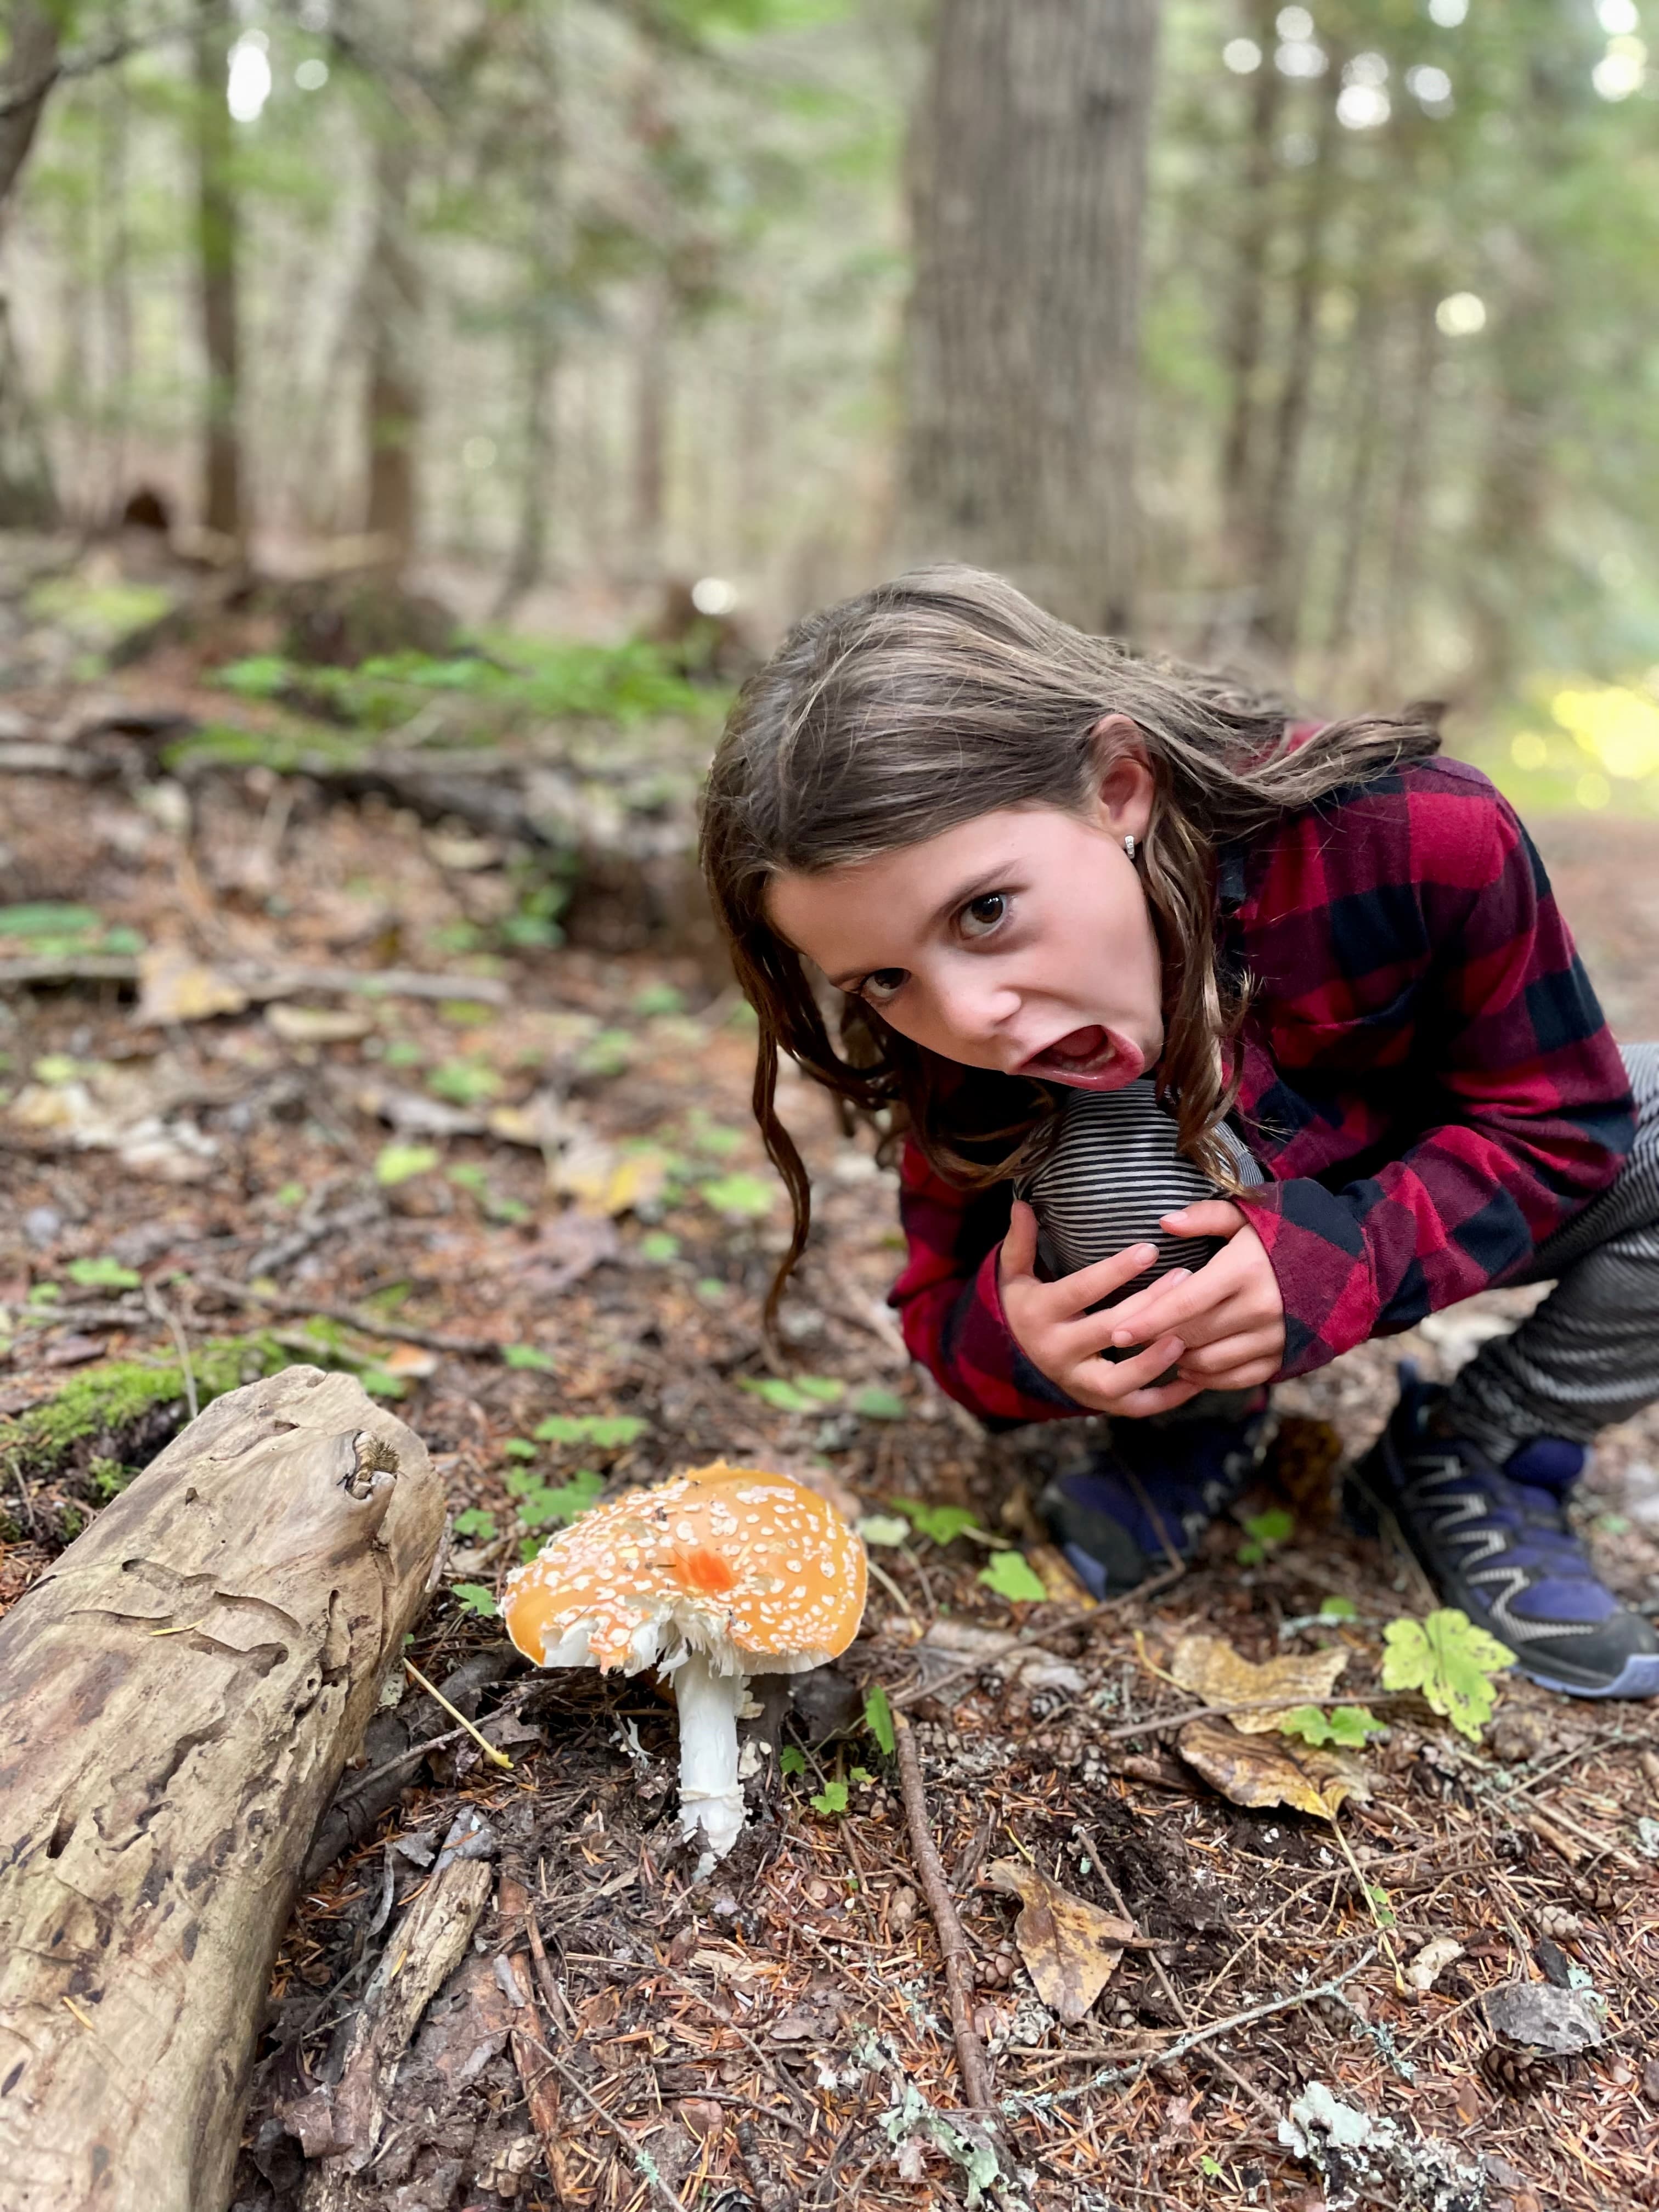
Fall is mushroom season, and a spore print is how people who study fungi tell many of them apart. Take a mushroom with an open cap and visible gills, cut off the stem, and set the cap gills-down on paper (half white, half dark, so any colour shows). Cover it with a bowl and leave it overnight. In the morning, lift the cap carefully: the spores have dropped into a print of every gill. An open-cap portobello from the grocery store works well (small button mushrooms are too young). If you use wild mushrooms, handle them with gloves, wash hands after, keep them away from little ones who put things in their mouths, and never eat a wild mushroom you have found.
Picking by age
Every one of these works from 6 to 14. What changes is how much of the thinking your kid does on their own.
Ages 6 to 8
Counting, sorting and noticing. Tally marks for the leaf count, sorting tree photos in order, the yarn hunt, the spore print. Ask “what changed?” and “what do you think will happen tomorrow?” and write down their answers word for word. Their prediction being wrong is part of the fun.
Ages 9 to 11
Tables, graphs and averages. Timing seed drops and averaging them, graphing the falling leaf count, subtracting sunset times. This is the age for one real prediction with a date on it, written down before the data comes in.
Ages 12 to 14
Fair tests and write-ups. Change one thing at a time (wing size, leaf colour, yarn colour), run enough trials to trust the result, and explain it in a one-page report or a short talk at dinner. The leaf chromatography and the first-frost prediction both make good projects at this age.
How to keep it going for six weeks
Don’t try to do all twelve. Pick one daily investigation (the tree, the leaf count, the daylight or the frost) and one or two one-off experiments for weekends. The daily one is the real learning, because it is the one where your kid sees a pattern show up that they couldn’t have guessed on day one.
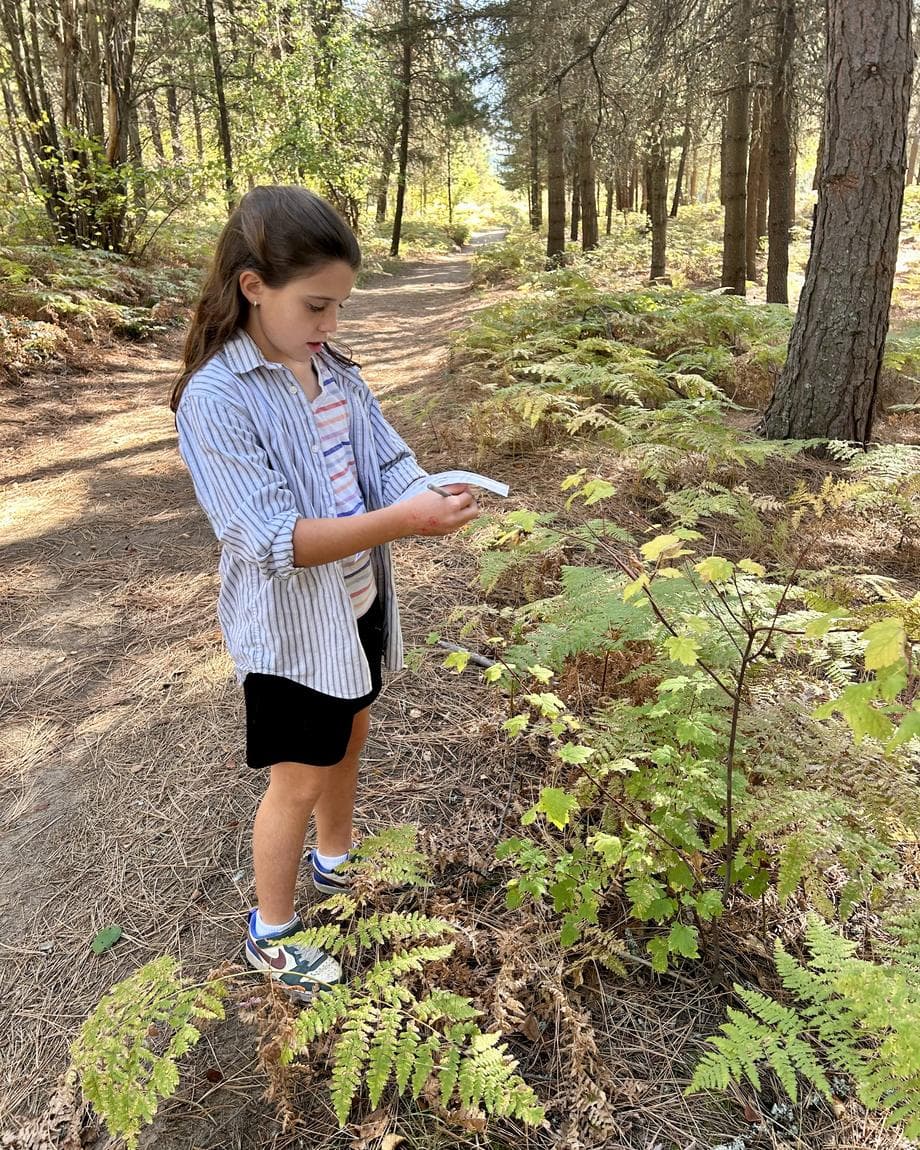
Keep everything in one notebook, and give it a page a day. Even a three-word entry counts. If your kid likes drawing what they see, our guide to nature journaling for kids has a simple way to start that doesn’t require anyone to be good at art. For walks where you want something lighter, the seasonal nature scavenger hunts have a fall hunt ready to print.
Fall doesn’t wait. In six weeks the leaves are down and the experiment is over until next year. Pick one tree this week and take the first photo.
And if you would rather open a guide that walks your kid through it step by step, that is what the Anywhere Learning membership is for: real-world, hands-on activities for ages 6 to 14, from seed science to decomposition to tracking the weather, ready to open on any device.
Want this as a free printable? Grab the Seasonal Scavenger Hunt Checklist: 17 Finds, free to read, and the printable version lands in your inbox.